Profiling runways
Posted: 16 June 2006 | Marc Stet, member of the CROW Airport Study Group on PCN and the Study Group on Runway Roughness | No comments yet
Aircraft computer simulation is effective in identifying and assessing aircraft response to pavement roughness, as Marc Stet explains. The responsibility for runway roughness lies with each individual airport operating authority. ICAO’s Annex 14 contains only very general information regarding airfield pavement roughness.
Aircraft computer simulation is effective in identifying and assessing aircraft response to pavement roughness, as Marc Stet explains.
The responsibility for runway roughness lies with each individual airport operating authority. ICAO’s Annex 14 contains only very general information regarding airfield pavement roughness.
Runway roughness assessment is a discretionary activity that is often undertaken in response to known roughness problems or complaints received from pilots or airlines. Nowadays, aircraft ride simulation technology has become available and can assist airport authorities to make roughness managerial pavement parameters. Runway surface quality is of interest to the airport community. A runway pavement surface must not have any irregularities which create roughness that could adversely interfere with operation of the aircraft, result in loss of friction, or cause downloading or even structural damage to the aircraft itself. Surface roughness, the opposite of smoothness, is critical for the safe operation of aircraft during takeoff and landing runs.
Join us live: Shaping the Next Generation of Hold Baggage and Air Cargo Screening
Join us live for an insightful webinar on 11th December at 14:00 GMT, in collaboration with Smiths Detection, as we explore the strategic balance of operational efficiency, regulatory compliance, and sustainability in high-volume security environments.
This session offers a focused look into future-proofing your security strategy.
Key learning points
- Cost Reduction: Strategies to minimize bag travel time while simultaneously reducing operational costs.
- Regulatory Roadmap: Insights into the next wave of regulatory changes and their impact on future investment decisions.
- Sustainable Systems: Practical approaches to building sustainability into security systems and lowering the total cost of ownership (TCO).
- Scalable Solutions: Real-world examples of scalable systems supporting current airport growth and preparing for tomorrow.
Register now for expert insights, case studies, and actionable strategies on operational efficiency!
Minor roughness is usually ‘built-in’ to new pavements during construction, as construction techniques are not perfect. Differential vertical movements within the pavement structure such as frost heave, settlements and changes in sub grade soil conditions can result in surface roughness. Thirdly, roughness increases rapidly as a pavement nears the end of its service life when the surface begins to breakdown under traffic and maintenance patching becomes more extensive.
A recent study undertaken by CROW reviewed the potentially available measurement devices & systems for accurate profile measurements and assessments. This article summarises the current state of the practice in Runway Roughness Assessment.
Surface roughness and texture wavelength
The term surface ‘roughness’ as discussed in this article should not be confused with the fine-scale surface roughness of a pavement, properly known as micro and macro texture, which can be felt by running an open hand over the surface. Although pavements can be rough in a transverse direction (perpendicular to the runway centreline), normally roughness measurement and analysis focuses on the roughness present in the longitudinal surface profile, parallel to the direction of aircraft operation. Table 2 defines the types of texture wavelength with ranges of deviation of a pavement surface from a true planar surface, with various wavelengths. When evaluating an airfield pavement for ride quality, it is important to obtain all undulation wavelengths associated with the pavement.
Profile measurement
Airport runways are ‘busy places’ and obtaining the required access time to complete the survey measurements may be difficult. The profile survey method must be quick, economical, detailed and accurate. A pavement’s profile can be measured by a variety of devices. Each device produces only one of two types of profile data: relative profile or true profile.
Relative profile can be defined as the variation in elevation from one data point to the next. Relative profile is often generated by an inertial profiler and is known as Class II surveys. Examples of class II devices are portable laser profilers and multi-laser instrumented vehicles. An inertial profiler measures the pavement’s elevation profile by establishing an inertial reference and measuring the pavement’s elevations in relation to the external reference. Specifically, the inertial reference is established by using a height-sensing device to measure the distance between the vehicle and the pavement’s surface. An accelerometer, mounted above the height sensor, records the vertical accelerations experienced by the vehicle while measuring the pavement’s profile. The accelerations are then mathematically converted into vertical displacement of the vehicle. This data is then merged with the elevation data measured with the height sensor. The vertical displacement values are then subtracted out of the elevation data in order to calculate the relative elevation of the pavement. Laser profilometers developed for measurement of pavement roughness or serviceability index calculation in highway pavements may be adapted for evaluation of airport pavements. However, most laser profilometers catch wavelengths up to 45 metres only, whereas an aircraft responds to wavelengths up to about 120 metres. The software filters out the effect of grade on calculation of pavement roughness. In adapting those profilometers, consideration should be given to removing or setting filters to permit the longest wavelength roughness to be measured.
A ‘true elevation’ profile is highly desirable. These are known as Class I surveys for their high accuracy and usually require some type of ‘static’ profiling device. The method requires that the longitudinal surface profile of the runway be measured. This takes longer and costs more but it makes a more detailed analysis possible. A runway profile can be analysed using a computer for a variety of short bump length roughness indicators and also for long bump length roughness up to and exceeding the wheelbase length of the aircraft nose/main landing gear. Individual bumps and depressions which may be rough to an aircraft can also be located. These methods require measurement of the longitudinal surface profile with a sufficient degree of vertical accuracy (0.1 mm) and a sufficient close elevation shot interval (0.3 m). Profiles measured by conventional rod and level survey can still be useful and analysed quite successfully depending on the type of roughness problem in the surface. However, rod and level survey shots should not exceed a 5.0 metre interval spacing. Since rod and level profiles can not be analysed for short bump length roughness indices, combining them with the data of inertial profilers is a useful mean. Rod and level data can also be used to minimise the level error by means of a closed loop survey, improving the accuracy of the topographical data derived with walking profilers.
Class III surveys are mainly used for pavement quality assurance and quality control. Profilographs and Straight Edge meters check the pavement against profile based specifications. Tender documents specify the allowable ‘builtin’ deviation during construction.
Profile analysis and roughness criteria
Measuring the airfield pavement’s profile is one matter; adequate analysis of that measured data is something else. Currently, there are several methods of quantifying the roughness of measured profile. Most criteria and standards use a straight edge analysis or use a profile analysis for isolated bumps. Aircraft simulation is a third technique of quantifying a pavement’s ride quality.
Smoothness acceptance criteria
The ICAO and the FAA straight edge acceptance criteria for new pavements recognises single event roughness. The FAA smoothness criteria and the ICAO standard of construction criteria of Figure 1 are intended as guides for new runway construction. The FAA allows a 6.35 mm over 3.66 and 4.88 metres for asphalt and PCC pavements respectively, while the ICAO standard is 3 mm over 3 metres. The ICAO tolerable limit recognises that runways deteriorate with aircraft operations and differential settlement. In general, isolated irregularities on the order of 2.5 to 3 cm over a 45 m distance will not seriously hamper aircraft operations, according to ICAO. However, it was recognised by ICAO that exact information of the maximum acceptable deviation cannot be given, as it varies with the type and speed of the aircraft. ICAO also lists criteria for the maximum change in consecutive longitudinal slopes that should not exceed 1.5 per cent.
The Boeing Company developed a bump height wavelength curve that has been widely used in evaluating pavement roughness level.While this method does identify much of the roughness that causes unacceptable aircraft response, it cannot account for the velocity of encounter, the aircraft type or the event of multiple roughness. The Boeing criteria are applicable to commercial passenger jet transports. Other criteria lines developed by various agencies such as the United States Air force Military Specification 8860 series (USAF), the International Civil Aviation Organisation (ICAO) and the United States Federal Aviation Administration (FAA) are shown in relation to Boeing criteria in Figure 1. The Boeing Curve (existing pavements), the three-metre ICAO straight edge criteria, and the FAA 16 foot straight edge criteria are all straight edge analyses. These techniques are valuable in identifying single bumps and dips of certain wavelengths. However, they will not identify the effects of multiple event roughness.
International Roughness Index
The International Roughness Index (IRI), established by the World Bank for highway use, is also used to quantify roughness levels on airfield pavements. The IRI is calculated for a single profile. An IRI of 0.0 means the profile is perfectly flat. There is no theoretical upper limit to roughness, although pavements with IRI values above 8 m/km are nearly impassable except at reduced speeds. The IRI is used as a general condition indicator. Transport Canada recently proposed a draft for a Canadian standard of pavement roughness, using the Riding Comfort Index (RCI), based on IRI (International Roughness Index) and RMSVA (Root Mean Squared Vertical Acceleration) index. As the IRI only uses small wavelengths undulations, IRI is not capable of assessing an airport pavement for long wavelength roughness or aircraft response. Aircraft predominantly respond to roughness events in pitch. The response of the main landing gear will drive the response of the nose landing gear. Therefore, a single suspension response prediction like IRI will not identify the effect of the longer wavelengths and their effect on aircraft ride quality.
Power Spectral Density (PSD)
Many of the early investigations have focused on measurement of roughness in the form of power spectra, which indicates the relative amplitude of roughness corresponding to wavelength. Power Spectral Density (PSD) gives an indication of average roughness of the runway, but does not distinguish between many bumps of small amplitude and a few bumps of large magnitude at a given wavelength. It is useful in the analysis of aircraft loads and fatigue problems, but it does not furnish information on the location of roughness along the runway.
Aircraft computer simulations
Aircraft ride quality simulation technology has evolved over recent years. Aircraft simulation could be considered the next best method (the best being an instrumented aircraft to record its response to the pavement’s profile). By predicting the aircraft’s response to the measured pavement profile, areas of roughness can be precisely located and the ride quality can be accurately quantified. Simulations can be made of takeoff, landing or constant speed taxi operations using a variety of aircraft types. This technology predicts the aircraft’s response (in accelerations) at the aircraft’s centre of gravity as well as the pilot’s station. Although standard criteria are not yet available for evaluating the results of aircraft roughness simulations, keeping the peak vertical acceleration experienced by the aircraft landing gear below 0.35 to 0.40 g’s (acceleration due to gravity) is generally considered an achievable and acceptable objective. The advantage of aircraft simulation is that it accounts for the response of the whole vehicle; how the main gear response drives the nose gear response. Because it is a response-based technique, the location of the event creating a ride quality problem is clearly identified (as seen in Figure 4).
Runway roughness criteria based on aircraft accelerations
Earlier airport pavement studies can be traced back to 1960’s. In 1967, NASA established an airport pavement roughness evaluation procedure using an aircraft’s vertical acceleration at the cockpit, setting maximum allowable acceleration to be 0.4g. Lee and Scheffel developed a relationship between aircraft gross weight and resonant frequency in 1968. The study also showed that aircraft traffic will worsen pavement roughness, and passengers in aircraft of different models on the same pavement will experience different rise quality. Merits must be given to Mr. Tony Gerardi one of the pioneers in the establishment aircraft simulation based airfield roughness criteria. In 1970’s, Gerardi et al. conducted a series of studies to develop a rigid-body aircraft model to simulate the vertical acceleration at the pilot’s station and the centre of gravity of aircraft. As well as pavement loading at main and nose gears. That model has degrees of freedom on pitch, roll, vertical and horizontal translation and it was verified with the filed data gathered from KC-135, B-52, F-4C and C-141. The model was further implemented to become the commercialised software, APRas (Airport Pavement Roughness assessment software). APRas has been widely accepted internationally. The accelerations at the pilot station and centre of gravity of the aircraft are weighed against a +/- 0.4g reference, which is defined as “the threshold of discomfort” as reported by Goldman and Von Gierke. The frequency boundaries of the range for human discomfort lies between 1 and 10 Hz. The .4g reference is also adopted in the FAA profile study.
Software for aircraft response to roughness
Modern software tools like APRas and PROFAA (PROfile FAA) calculate the dynamic response expressed as vertical accelerations at the pilot station and the aircraft’s centre of gravity. The dynamic load response is also calculated for the nose gear and the main landing gears PROFAA is a free program developed by the Federal Aviation Administration. PROFAA is the Federal Aviation Administration’s computer program for computing pavement elevation profile roughness indexes. Data analysis performed by the program includes the simulation of the following devices or procedure and the calculation of, Straight Edge, Boeing Bump, International Roughness Index (IRI), California Profilograph (PI), and RMS Bandpass Indexes (Root mean square of filtered heights). The straight edge length can be varied from 1.5 to 76.2 meters. PROFAA only simulates taxi operations, whereas APRas simulates takeoff and landing operation too. PROFAA simulates B727 an B747 taxiing on the pavement (profile) at a speed of 20 knots for taxiways and 100 knots is used for runways. Other aircrafts in the database are DC-9 and DC-10. It is important to recognise that by simulating aircrafts with long and short wheelbase (B747 en B727 respectively), areas of roughness can be detected. PROFAA can also be used to draw bar charts of section indices. APRas is more elaborate and simulates a wide variety of aircraft conducting, takeoff, landing and/or taxi operations, whereas PROFAA ‘only’ simulates taxi operations. Both programs calculate IRI and Ride Number indices. The index variables (deviation from straight edge or aircraft vertical acceleration, for example), when plotted over the full length of a runway or taxiway, provide a convenient means of identifying possible rough areas and evaluating strategies for remediation. Corrective design adjustments can then be made to smooth out the rough profile sections and the resulting effect on alleviating aircraft roughness response can be checked by repeating the simulations using the new smoothed profile. The method can also be used to engineer runway crossings.
Closure
While experience has shown that aircraft computer simulation is effective in identifying and assessing aircraft response to pavement roughness, there are no official criteria in place to compare the predicted results. There is an established need for an airport pavement roughness criteria. The need is recognised in both the US military and civilian sectors. It is also recognised as an international need by the International Civil Aviation Organization (ICAO). It is expected that the FAA practice will become the Industry Standard for assessing airport pavement roughness.


Table 1


Table 2: Definition of texture wavelength & spacial frequency (cycles / minute)


Table 3: Class I & II profiler systems
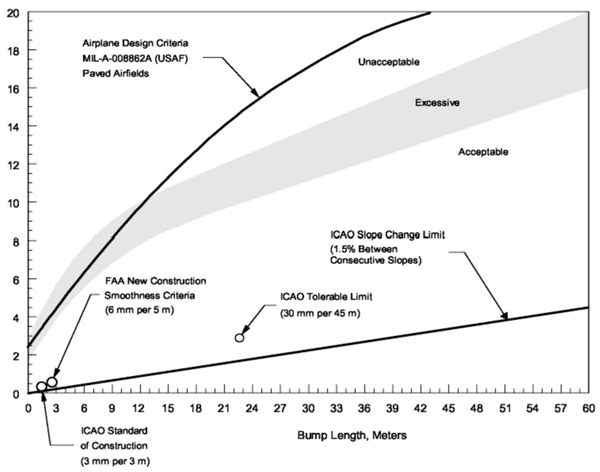

Figure 1: Comparison of roughness criteria (Courtesy: The Boeing Company)


Figure 2: IRI ranges represtented by different classes of pavement
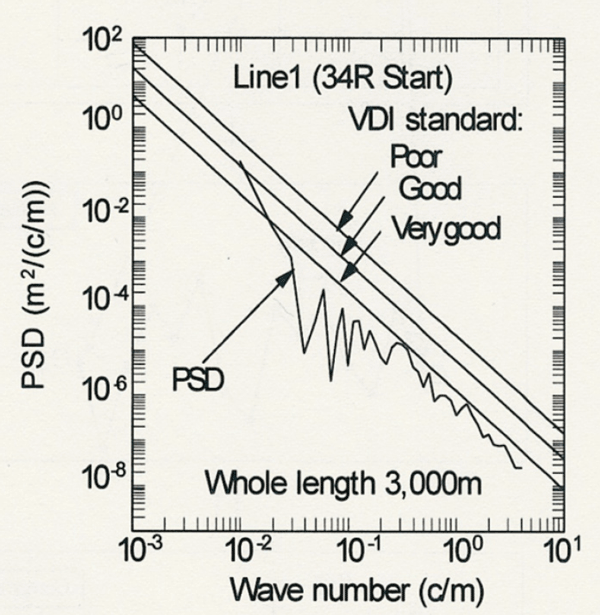

Figure 3: Example of PSD-analysis to runway profile
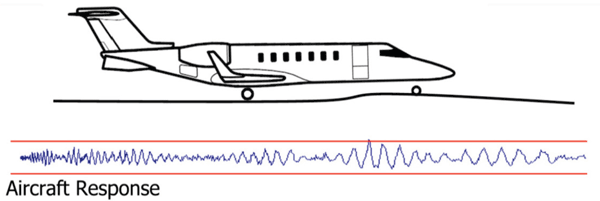

Figure 4: Aircraft response to measured pavement profile
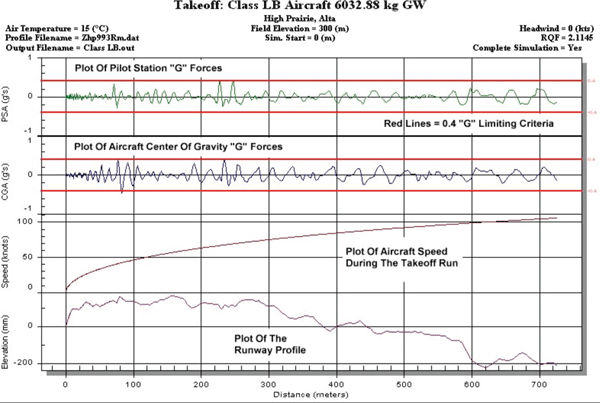

Figure 5: Typical takeoff simulation using ARPas software
References
CROW. Survey on Airport Pavement Roughness Assessment. Report 06-01. 2006. Gerardi, T.G. Dynamic Response of aircraft to pavement unevenness. FAA Conference on Research in Airport Pavements. Special Report 175. Transportation Research Board, pp.91-96. 1978. Gerardi, T.G. “Airport Pavement Roughness Software”. APRas Version 3, 2001. Gervais, E. Runway Roughness measurement, qualification and application. The Boeing approach. Proceedings. ASTM Conference on Airport Pavement Interaction. 1991. ICAO. International standards and recommended practices, Aerodromes, Annex 14 to the Convention on International Civil Aviation,Volume 1,Aerodrome Design and Operations, 3rd edition, ICAO, 2004. FAA. The Federal Aviation Administration Computer Program for Roughness Index Analyses. User’s manual (draft). PROFAA, 2004. Stet, M.J.A and M. Gerardi. Effects on Runway Roughness on Aircraft and Pavement. A novel approach for PMS interaction. PIARC International SURF 2000 Symposium, Nantes, 2000. Transport Canada Guidelines respecting the measurement and evaluation of airfield pavement surface roughness, TP312, 4th Edition, Transport Canada, International Aviation and Technical Programs Branch, Ottawa, Ontario, Canada, March 2005.
Join our free webinar: Beyond silos: How ecosystem thinking elevates the airport experience
In today’s complex aviation landscape, airports are moving beyond siloed operations to embrace a new era of collaboration. This webinar focuses on how leading airports are using ecosystem thinking to adapt, personalize, and continuously improve every touchpoint, boosting both passenger satisfaction and non-aeronautical revenue.
Date: 13 Nov | Time: 10:00 GMT
REGISTER NOW TO SECURE YOUR SPOT
Can’t attend live? No worries – register to receive the recording post-event.


