ProFAA – Software for Analysis of Airfield Pavement Roughness – and the Boeing Bump
Posted: 28 September 2007 | Gordon Hayhoe, General Engineer, Airport Technology R&D Branch, FAA | 1 comment
Until recently, the primary interest in measuring and evaluating the properties of airport pavement surface profiles has been, at least in the US, in characterising the vertical geometry and the smoothness of newly constructed pavements.
Until recently, the primary interest in measuring and evaluating the properties of airport pavement surface profiles has been, at least in the US, in characterising the vertical geometry and the smoothness of newly constructed pavements.
Federal Aviation Administration (FAA) acceptance criteria for these pavement properties are contained in Advisory Circular AC 150/5370-10B, ‘Standards for Specifying Construction of Airports.’ For grade control, the as-constructed grade must not deviate from the design grade by more than 12 mm (0.5 inches) at any point on the surface. For smoothness, the maximum deviation from a 4.9-m (16-foot) straightedge must not exceed 6.4 mm (0.25 inches) at any location on the pavement. Optionally, a California-type profilograph may be used with a sliding scale for payment, although the straightedge requirement is not waived in cases where there is a conflict between the two types of measurement. (Consult AC 150/5370-10B for the complete specifications and see AC 150/5300-13, ‘Airport Design,’ for the vertical geometry requirements.) Experience has shown that, when the pavement has been properly designed and construction meets the grade and smoothness tolerances stated above, the resulting pavements are safe for aircraft operations with regards to accelerated gear load damage, airframe fatigue damage, pitch and roll motions, and accelerations experienced in the cockpit.
As pavements age and suffer damage from repeated loading or, more rarely, construction deficiencies, their roughness increases and ride quality deteriorates. With increasing traffic and airport utilisation rates it is becoming evermore important to efficiently prioritise and schedule maintenance. The need is increasing for airports to periodically survey their pavements and to characterise the roughness using established methodologies. Improvements and availability of equipment to accurately measure profiles and computer systems to do the analysis, together with overall declining cost, are encouraging airports to include profile and roughness data in their pavement management systems. To address this new opportunity the FAA is preparing a new advisory circular intended to provide guidelines for measuring and reporting airfield pavement roughness. In its initial release, the new AC will address the identification of isolated disturbances on pavements by the use of the Boeing Bump. Subsequent additions to the AC will address the problems of characterising the roughness of a pavement over its full length and identifying numerical limits for triggering maintenance or rehabilitation based on these alternative measures. Supporting the guidelines in the AC is a software package for analysing airfield pavement profiles called ProFAA. The software package is available for free download from http://www.airporttech.tc.faa.gov. The Boeing Bump methodology has also been submitted to ICAO for consideration as an ICAO standard.
Features of ProFAA include:
- Index Computations
- California-type Profilograph Profile Index (PI)
- Boeing Bump Index (BBI)
- International Roughness Index (IRI)
- Band-Pass Index (objective measure for Ride Number computation)
- Simulations
- Straightedge
- Four aircraft types (B727, B747, DC-9, and DC-10-10)
- Displays of the profile and index computations over the full length of the profile, with zoom capability
- Display of the index values over user selectable section lengths
- Display of probability distributions (percent exceedances) for straightedge and BBI
- English or Metric units
Figure 1 shows a screen shot of ProFAA with a profile measured at a small regional airport displayed in the top pane. The second pane shows the maximum deviation from a 4.9 m straightedge, the third the BBI, the fourth the rectified slope computed from the IRI quarter car simulation, the fifth the vertical follower wheel motion computed from the profilograph simulation, and the sixth the bandpass filter output. The sample spacing for each of the displayed variables is 25 mm, 150 mm, 250 mm, 150 mm (as input to the standard IRI algorithm), 150 mm, and 25 mm, respectively. Average values of the computed variables or the index value over the full length of the profile, as appropriate, are displayed in the lower frame on the left of the window. Averages and index values are also computed over user specified section lengths and can be displayed in a separate window by pressing the Show Bars button in the lower left corner. The default section lengths are 304.8 m (1,000 ft) for all except for the Profilograph PI calculations which are over section lengths of 152.4 m (500 ft).
Figure 2 shows the bar chart for the BBI averaged over 304.8 mm (1,000 ft) sections. The numerical values are also output to a text file in the application directory. Pressing the In/Out button at the top left allows probability distribution functions (PDFs) to be displayed for the straightedge maximum deviations and the BBI values. Figure 3 shows the PDF for the straightedge deviations. From the figure, 85 percent of the maximum deviations are less than 2.8 mm (0.11 in) and the largest value is 7.9 mm (0.31 in).
The profile in Figure 1 was measured at an airport which had been rehabilitated twenty years earlier to carry single-aisle commercial jets but had never actually seen operation of those aircraft. The airport was also in an area with a mild climate. Consequently, the pavement was in good structural condition and showed smoothness normally expected of new pavements, and represents an operational pavement at the lower extreme of runway roughness, as indicated by the very good results for the straightedge and the Profilograph PI numbers. In contrast, Figure 4 shows a screen shot for a profile measured at an airport with roughness at the other extreme, despite also being a regional airport. In this case, the pavements carried heavy freight traffic and were located in an area with a significantly harsher climate. The straightedge and PI numbers exceed new pavement smoothness criteria by wide margins: More than fifty percent of the straightedge maximum deviations exceed 6.4 mm (0.25 in) and the PI numbers are ten times larger than for the first pavement shown in Figure 1. However, there are no limiting criteria which allow the straightedge and PI numbers to be used to determine if the pavement is too rough.
The same goes for the IRI and Bandpass numbers because the criteria associated with these two methods are based on ride quality experienced by car drivers and passengers, not the occupants of airplanes traveling at high speed on a runway, or the damage levels experienced by the airplane structures. However, the BBI is defined relative to a limiting criteria where a BBI value of less than one indicates that the pavement is acceptable and a value greater than one indicates that the pavement is in need of repair as soon as is practical. In fact, the Boeing Bump currently provides the only established criteria for declaring that the roughness of an airport pavement is, in all likelihood, unacceptably high, except, of course, for pilot complaints. Airplane simulations are frequently used to evaluate airport pavement roughness, but the simulations, and associated criteria, are neither standardised nor calibrated to the same extent as those used to evaluate highway pavements.
The display of the BBI in Figure 1 shows a maximum value of 0.414 and indicates that, as would be expected from the low values of the other computed results, the pavement is fully functional with regard to roughness effects for single-bump occurrences. On the other hand, the maximum BBI in Figure 4 is 1.13, indicating that the runway is in need of attention. This maximum value is at the end of the runway and it is likely that high speed operations did not occur over the bump (or depression) with aircraft either taxiing over the disturbance or lifting off before reaching it. But there are at least nine other locations on the runway where the BBI is greater than 0.8 and the pavement is undoubtedly rough (it was overlaid shortly after the profiles were measured).
Boeing Document D6-81746, “Runway Roughness Measurement, Quantification, and Application – The Boeing Method,” describes in detail the development of the Boeing Bump methodology. The development dates from the early 1960s when an evaluation of large military aircraft operating on paved and semi-prepared gravel pavements led to a set of limiting criteria defined in terms of bump height versus wavelength for individual disturbances. Between then and 1995, the wavelength was changed to bump length and the criteria were gradually refined by a combination of aircraft simulation, measurements of aircraft accelerations at the centre of gravity during ground operations, pilot comments from operations on known runways, satisfactory aircraft operations on known runways in terms of structural fatigue, and fatigue tests run on test stands. The resulting methodology is the same as that for a rolling straightedge except that the length along the straightedge to the point of maximum deviation is reported in addition to the maximum deviation, and that the straightedge length is allowed to vary from three times the space between the elevation measurements to 120 metres (maximum bump length of 60 metres). The limit criteria adopted in 1995, and as implemented in ProFAA, are shown in Figure 5. These were plotted in the figure from curve fit equations derived to match the limit curves in Figure 10 of Boeing Document D6-81746.
In the ProFAA implementation of the Boeing Bump methodology, a straight line is positioned with the start of the straight line on a profile sample point and the end of the straight line on the sample point corresponding to the length of the straightedge along the profile. Bump height, bump length, and a bump index are calculated as follows:
Bump Height = Maximum vertical distance between the straight line and the profile over all sample points between the start and end points.
Bump Length = Smallest of (a) the distance along the profile between the start of the straight line and the bump height position or (b) the distance along the profile between the bump height position and the end of the straight line.
Bump Index = Bump height from the straight line divided by the bump height of the lower limit curve in Figure 5 corresponding to the calculated bump length.
The calculations are repeated for all straightedge lengths starting at the same sample point and the maximum bump index is found over all of the straightedge lengths. This maximum is defined as the BBI for that starting sample point. New starting points are selected and the procedure repeated until a BBI has been computed for all of the sample points.
If the BBI at a particular location on a pavement has a value greater than one, the bump height and bump length position on the criteria chart relative to the upper limit line separating excessive from unacceptable can be found by right clicking on the BBI display at the location of the large BBI. A zoomed version of the profile at that point will be displayed in a lower pane and the straightedge shown in its correct relation to the profile as shown in Figure 6. The position where the bump height was calculated is marked by a vertical line. Numerical values for the BBI, bump height, bump length, and straightedge length are also displayed. The bump height and length can then be read and plotted on the Boeing criteria chart. In Figure 6, the bump height calculation was made at the extreme right of the straightedge and the bump length is extremely small compared to the length of the straightedge. It is therefore very important to get complete information on the calculation before assessing the severity of a particular disturbance on a pavement and evaluating possible remedies.
Guidance on the application and interpretation of the BBI can be found in Boeing Document D6-81746 and in the forthcoming advisory circular. For example, quoting from the summary in the Boeing document:
“The Boeing roughness criteria has been developed for what is considered the most critical condition for runway roughness – a heavily loaded aircraft approaching takeoff speed. Aircraft moving at taxi speeds or operating at a relatively light weight would not experience as severe of a g-loading as at the takeoff condition. These other conditions are best served by consideration of the ‘excessive’ region of the Boeing criteria between the ‘acceptable’ and ‘unacceptable’ areas. Upper bounds of the ‘excessive’ region designate the beginnings of critical landing gear fatigue, while the lower bounds are the limits of comfort for both passengers and pilots.”
Acknowledgements
Thanks are due to Rodney Joel of the FAA’s Office of Airport Safety and Standards for help in the preparation of this article. Boeing Document D6-81746 can be obtained directly from the Boeing Company or downloaded from www.airporttech.tc.faa.gov.
The views expressed are those of the author and do not represent official FAA or Boeing policy.
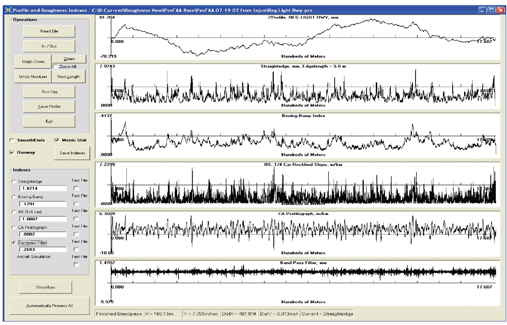

Figure 1: Screenshot of ProFAA displaying an elevation profile of a runway at a small regional airport with index computation time histories and index averages
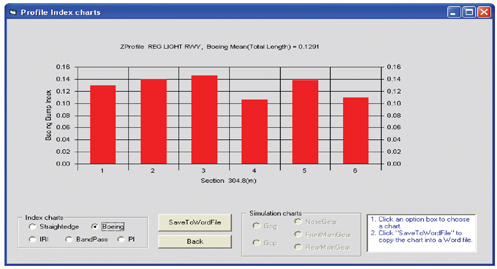

Figure 2: Bar chart showing the Boeing Bump Index values in figure 1 averaged over 304.8 m (1,000 ft) section lengths (the last section is an odd length because the profile is not exactly 1,828.8 (6,000 ft) long
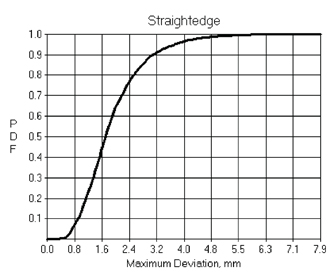

Figure 3: Probability distribution function showing the fraction of maximum deviations from the straightedge less than an indicated limit
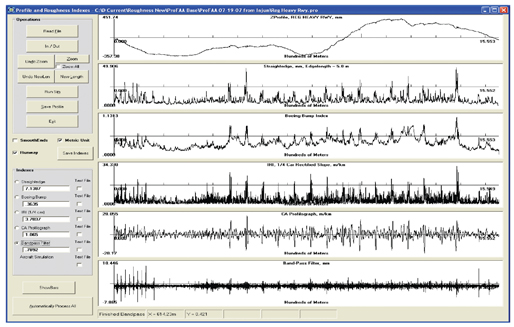

Figure 4: Screen shot for a very rough operational runway pavement
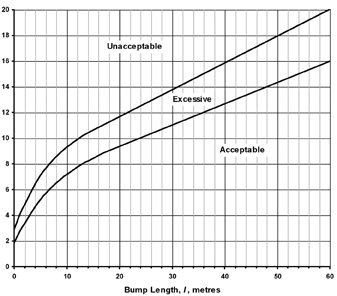

Figure 5: Boeing Bump criteria
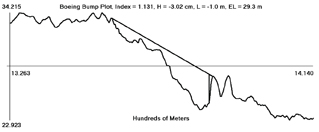

Figure 6: Details of the profile and straightedge configuration for BBI calculation at the point of maximum BBI in Figure 4
About the author
Dr. Hayhoe is a General Engineer at the Airport Technology R&D Branch, the FAA William J. Hughes Technical Center, Atlantic City International Airport, New Jersey. He is Manager of the National Airport Pavement Test Facility and is also responsible for research and development in the area of airport pavement design and evaluation. Dr. Hayhoe has been with the FAA for ten years. He previously worked at Galaxy Scientific Corporation, Egg Harbor Township, New Jersey, and the Pennsylvania Transportation Institute, the Pennsylvania State University, in the areas of pavement design and evaluation, the measurement and analysis of pavement surface properties, and vehicle dynamics. He is a member of ASTM Committees E17 (Vehicle-Pavement Systems) and F09 (Tires). He earned his Master’s and Doctoral degrees from the Cranfield Institute of Technology, Bedford, England in 1969 and 1973 respectively.
The International Airport Summit is open for registration!
Date: 19 – 20 November 2025
Location: JW Marriott Hotel Berlin
At our flagship event of the year, we will dive into the future of airport operations, with expert-led sessions on passenger experience, innovative smart technologies, baggage handling, airside operations, data, security, and sustainability.
This is where global airport leaders come together to share insights, challenges, and real-world solutions.
Limited complimentary passes are available for eligible professionals – first come, first served!


what is the usage of G-Value in case of the BBI is less than 1 and sill pilot issuing complains about the comfortability.